System monitoring tools are essential for any IT team to keep track of infrastructure health, performance, and availability. With the right monitoring solution, you can catch issues before they cause outages, optimize resource usage, and maintain robust visibility into your environment. But with the plethora of options available, how do you determine what tools are truly the best? This comprehensive guide outlines the top 21 system monitoring tools available today. We’ll cover options suited for various use cases and budgets to help you find the right fit.
Why Do You Need a Monitoring Tool?
Before diving into the top tools, let’s discuss why system monitoring is so critical in the first place:
- Prevent Outages: By keeping continuous tabs on all components, you can catch problems early and prevent major system failures or performance degradations. This minimizes downtime and data loss risk.
- Optimize Efficiency: Monitoring gives you visibility into usage and workload patterns so you can right-size resources and maximize efficiency.
- Support Planning: By analyzing historical performance data, utilization trends, and capacity forecasts, you can better plan budgets, staffing, and other administrative concerns proactively.
- Meet Compliance & Security Requirements: Many regulatory standards mandate environmental monitoring, log collection, and auditing to prove due care and diligence.
- Enhance Visibility: Comprehensive monitoring provides insights into relationship maps, dependencies, and overall ecosystem health beyond the scope of individual data points.
The right monitoring tools make all of these critical business objectives possible. Keep reading for the top options to consider.
Monitoring Methodology
Before exploring individual tools, it helps to understand the various monitoring techniques and methodologies. The main categories include:
Agent-Based Monitoring
Agent-based monitoring relies on small programs installed on servers, devices, orwithin applications to collect granular operational data and statistics. Agents can access information that external systems can’t. But they add overhead, require maintenance, and don’t cover every data source.
Agentless Monitoring
Agentless monitoring utilizes external scanning and data collection without requiring anything to be installed internally. This simplifies deployment but offers less visibility than agent-based alternatives. Hybrid tools offer both agent-based and agentless monitoring.
Synthetic Monitoring
Synthetic monitoring simulated user transactions to measure end-user experience from outside the network. This detects problems that only emerge under load that component monitoring might miss.
AIOps
AIOps platforms utilize artificial intelligence, machine learning and big data analytics to detect anomalies, correlate insightsacross diverse data sets, and enable autonomous issue resolution. This amplifies the value of traditional monitoring data.
Best System Monitoring Tools List
Understanding these core methodology differences helps match options to use case requirements. Now let’s explore the top tools in each category.
Network Monitoring Tools
Network monitoring tools focus on availability, bandwidth utilization, device uptime, and packet flow analytics across wired and wireless environments. Top options include:
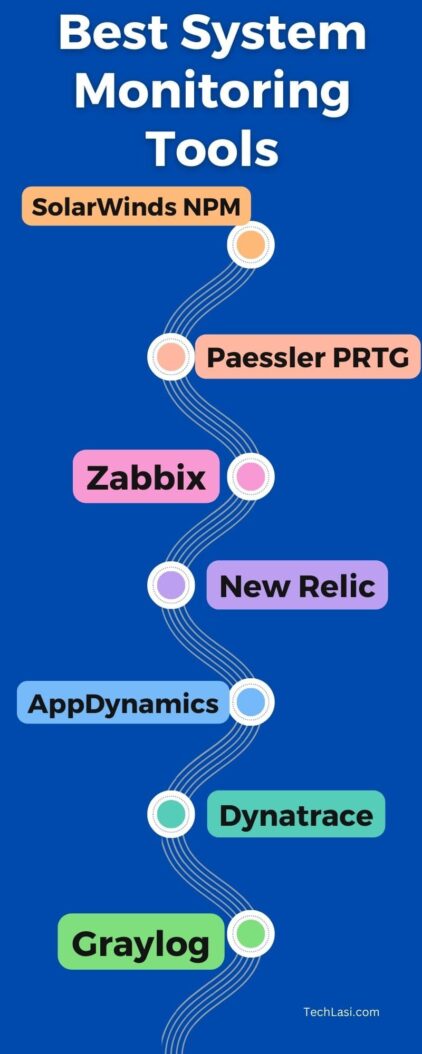
1. SolarWinds Network Performance Monitor (NPM)
SolarWinds NPM tops enterprise network monitoring lists for its deep Cisco integration, user-friendly UI, custom mapping and reporting, and other premium features. It offers agent-based and agentless monitoring to complement NetFlow and SNMP data with detailed performance metrics. Automated network mapping and monitoring wizards accelerate deployment.
2. Paessler PRTG
PRTG earns praise as a highly customizable hybrid network monitoring solution. The interface visualizes device status, network usage, response times, and other critical performance indicators on live dashboards. Scalable licensing, broad device support, and cloud deployment options provide flexible value across environments.
3. Ipswitch WhatsUp Gold
WhatsUp Gold shines for mid-market IT shops seeking an affordable solution that doesn’t compromise on value. The award-winning platform reveals performance trends through interactive maps, charts, and graphs. Robust alerting, troubleshooting tools, and historical reporting provide actionable insights for optimization.
4. ManageEngine OpManager
OpManager captures attention for its automated single-pane-of-glass network monitoring abilities across on-premises and cloud environments. The centralized platform monitors physical and virtual networks alongside public cloud resources and applications. Strong analytics and reporting cater to diverse stakeholder needs.
5. Datadoghttp://Datadog.com
Datadog lives up to its popularity for delivering AIOps-enabled network visibility as a SaaS platform. Machine learning detection identifies network anomalies automatically for rapid remediation. Distributed tracing illuminates interactions among dynamic infrastructures. Plus, it integrates neatly with cloud-native stacksand popular DevOps tools.
Server Monitoring Tools
Server monitoring zooms in on OS, hardware utilization, and performance metrics for physical hosts, virtual machines, and application services. Leaders in this category include:
6. Nagios XI
Long beloved by system administrators, Nagios enters the conversation for its breadth of coverage across on-prem and cloud assets. The open-source core offers limitless customization potential. Meanwhile the commercial XI edition removes guesswork with turnkey server monitoring templates, role-based access controls, and support services to streamline large deployments.
7. Zabbix
Another open-source monitoring solution with an impressive commercial edition is Zabbix. It stands out for native autodiscovery of resources and auto-registration of devices. An intuitive UI with at-a-glance graphics identifies current and historical server performance in context. The scalable platform equally meets the needs of small shops and global enterprises.
8. SolarWinds Server & Application Monitor (SAM)
SolarWinds SAM sets server monitoring benchmarks as a top-rated solution built specifically for on-prem environments. Agentless and agent-based monitoring options provide layered visibility while its application stack monitoring is second to none. Integration with the larger Orion suite amplifies its usefulness within hybrid infrastructure estates.
9. PRTG Network Monitor
Beyond network monitoring, PRTG shines just bright as a server and cloud infrastructure management tool. Granular device dashboards highlight CPU, memory, disk usage, running processes, and other server performance indicators. Broad platform support plus customizable alerts and reporting give IT teams actionable insights for proactive management.
10. IBM Tivoli Monitoring
For large enterprises invested in IBM environments, Tivoli Monitoring commonly leads server monitoring evaluations. Strengths include advanced AIOps analytics and SLAs that trigger alerts automatically when defined thresholds breach. Consolidated views then contextualize issues across highly distributed estates including mainframes.
Website & Web Application Monitoring Tools
Measuring real user experiences requires specialized web and application performance monitoring solutions. Top options include:
11. New Relic
The SaaS favorite earns its stripe for delivering instant full-stack observability across dynamic web environments. Code-level application insights complement browser and synthetic availability monitoring for context around web app performance. Powerful data visualization and flexible collaboration options make New Relicaccessible to non-technical staff too.
12. AppDynamics
A top APM choice for large DevOps shops is AppDynamics. It auto-discovers web transactions to construct flow maps linking code to business outcomes. Integrated database, analytics, and machine learning modules amplify insights. Dashboards spotlight application performance aligned to organizational priorities rather than technical KPIs speeding root cause analysis.
13. Dynatrace
Ultra-powerful purepath technology fuels Dynatrace’s APM and digital experience monitoring. This follows transactions through every infrastructure tier mapping subcomponents to overall UX. An instant topology UI then visualizes the full architecture. Side-by-side event comparisons instantly validate performance dips to expedite troubleshooting.
14. SolarWinds Pingdom
Pingdom dominates website experience monitoring as an affordable yet featurerich SaaS. Real browser checks from 60+ global locations monitor uptime and responsiveness. Performance breakdowns quantify page load times while its transaction check feature mimics user journeys. API integrations streamline embedding monitoring data across platforms.
Log Management & Analysis Tools
Logging offers forensic evidence into security, compliance, and operational events. Leading options to aggregate, analyze, and act on those insights include:
15. Splunkhttp://Splunk.com
The king of security information and event management (SIEM) solutions remains Splunk. While pricy, the AIOps-driven platform captures and correlates data from across on-prem, multi-cloud, and hybrid environments. Visualizations spotlight anomalies with advanced analytics and machine learning accelerating incident response. Major regulatory compliance also makes Splunka go-to log analysis tool.
16. SolarWinds Loggly
SolarWinds Loggly packages its log monitoring and analytics as an affordable SaaS built ground-up for the cloud. Lightweight agents simplify setup for collecting data from any source. Cloud-native scalability handles unpredictable volumes while ensuring crunched numbers return in milliseconds. Curated dashboards spotlight patterns needing attention aided by intelligent correlation.
17. Sumo Logic
As another cloud-based log management favorite, Sumo Logic processes huge daily volumes in a single tool. Compliance templates get PCI, HIPAA, and other programs up and running quickly. Noise reduction and automatic parsing makes queried results more manageable so incidents emerge clearly. These insights then power customized risk scoring frameworks to focus security efforts.
18. Graylog
The open-source Graylog platform offers incredible customization potential for large security teams wanting to tailor systems to very specific organizational needs. Entry-level pricing opens doors for smaller IT teams boosting future scalability. Just beware that unlocking the most advanced functionality requires hefty enterprise investment, professional services, or impeccable in-house expertise.
19. Elastic Stack
Elastic Stack (formerly ELK Stack) integrates the Elasticsearch log database with Logstash for processing and Kibana for analysis. The combination enables collecting and contextualizing massive data volumes. Users praise rich visualization capabilities and lightning-fast search functionality. Just know upfront this powerful trio requires significant heavy lifting to optimize.
Specialized Infrastructure Monitoring Tools
Many monitoring tools claim full-stack coverage but fall drastically short of operational mainframes and hardware niches like storage arrays. Specialists filling this gap include:
20. IBM Tivoli Monitoring
In addition to server monitoring, IBM Tivoli also offers deep visibility and control across mainframe environments unmatched by competitors. Optimization and capacity planning tools leverage historical patterns to align workload balancing with strategic forecasts proactively. Security policies scan profiles ensuring adherence while meeting rigorous compliance burden of proof needs effortlessly.
21. SolarWinds Storage Resource Monitor (SRM)
SolarWinds SRM fixes limited native storage monitoring capabilities delivering centralized insights across varied arrays in context. Tracking capacity and throughput usage emergencifies potential shortages threatening application availability. Historical performance charting guides provisioning strategy aligned to workload demands not guesswork for optimum ROI.
Conclusion
Robust monitoring serves as the foundation for efficient, available, and secure IT operations. The diverse solutions and methodologies overviewed each bring unique strengths catering to particular environments and challenges. Top options like SolarWinds blend sophisticationwith accessibility through unified platforms addressing interdependencies web-scale estates introduce across layers modern technology stacks. Selecting tools purposefully based on use case rather than arbitrarily checks more boxes to get built-in value realizing monitoring’s abundive potential increasing productivity, compliance, and strategic impact. Reach out for personalized guidance identifying ideal solutions matching your technical roadmap and business objectives.
Frequently Asked Questions
What is the best free system monitoring tool?
Top-rated free monitoring tools include Zabbix, NetXMS, and LibreNMS. Each offers generous capabilities likely suiting basic network and server visibility needs quite well.
What is the easiest monitoring tool to use?
Easiest infrastructure monitoring tools for fast time-to-value without advanced know-how include SolarWinds, PRTG, and WhatsUp Gold. Intuitive dashboards, flexible alerting, and customizable reporting simplify getting started.
Which tool is best for large enterprises?
Leading large enterprise monitoring tools include IBM Tivoli, Datadog, Dynatrace, Splunk, and the Elastic Stack. Each scale to handle massive global infrastructures while balancing noise to spotlight priority incidents via advanced analytics.
What tool works best for public cloud monitoring?
Top cloud-native monitoring tools are Datadog, New Relic, and Dynatrace. Each integrates neatly with leading platforms like AWS, Azure, and Google Cloud while correlating telemetry alongside logs and metrics.
Which free tool should small businesses use?
For entry-level visibility meeting basic requirements at zero software cost, Zabbix, LibreNMS, and NetXMS each deliver surprisingly robust functionality many growing organizations rely on happily.

- How to Force Quit on Mac? (6 Methods That Actually Work) - May 24, 2026
- How to Move NFTs Between Blockchains (Complete Guide) - May 24, 2026
- How to Move a Column in Excel (A Simple Guide) - May 24, 2026