Introduction to Application Performance Monitoring
Application performance monitoring (APM) tools are vital for modern software teams to monitor and optimize their applications and systems. As applications grow larger and more complex, APM solutions provide visibility into performance, availability, errors, and resource usage. This allows developers to pinpoint problems quickly and maintain optimal end user experiences.
Why Application Performance Monitoring Matters
APM tools have become indispensable in today’s software landscape. Key reasons why include:
- Improve Customer Experience: Catching performance issues and errors rapidly improves user satisfaction.
- Optimize Efficiency: Understanding resource usage helps cost-optimize infrastructure.
- Accelerate Delivery: Faster problem identification means faster fixes and less downtime.
- Enhance Visibility: End to end visibility into complex, distributed systems is difficult without APM.
Top 23 Application Performance Monitoring Tools
Organizations have many choices when selecting APM software. Here are 23 top options to consider:
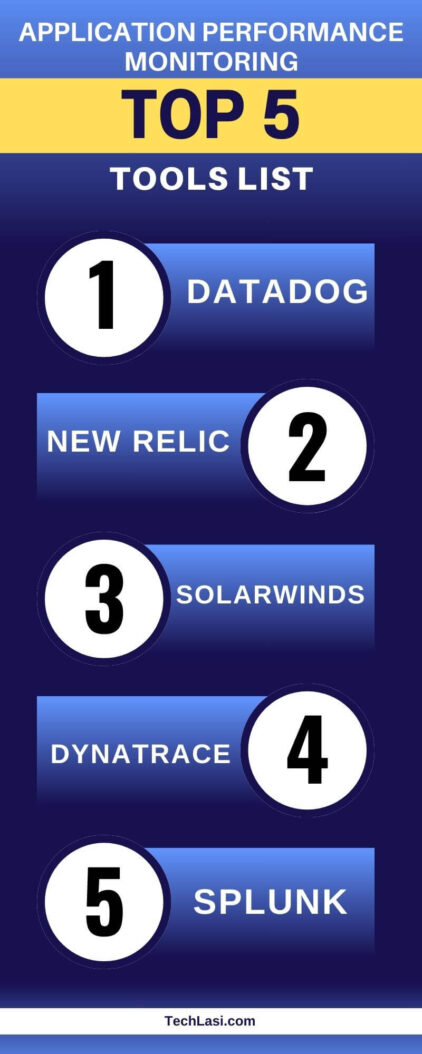
1. Datadog
Datadog is a full stack monitoring platform supporting metrics, tracing, logging, and more. Key features include:
- Integration with hundreds of technologies
- Dashboards for visualizing metrics
- Alerting for performance anomalies
- APM with distributed tracing
- Log analysis and analytics
2. New Relic
New Relic focuses on observability into application performance. It provides:
- Real user monitoring (RUM)
- Robust APM tracing and metrics
- Cross application maps and dashboards
- Alerting and collaboration tools
3. Dynatrace
Dynatrace has an AI powered approach to application and infrastructure monitoring. Capabilities include:
- Auto detected topology and mapping
- Code level visibility
- Smart alerts and instant root cause analysis
- User experience and performance monitoring
4. AppDynamics
AppDynamics is an application intelligence platform owned by Cisco. It features:
- Code level diagnostics with easy dynamic instrumentation
- Business transaction tracing and analytics
- Automated root cause analysis using ML
- Flexible dashboards and custom reporting
5. Splunk
Splunk is a leader in analyzing machine data. For APM, it provides:
- Real time operational intelligence insights
- Infrastructure, logs, metrics, and traces analysis
- Dashboards, alerts, reports, and more
- Direct integration with hundreds of data sources
6. Elastic
The Elastic Stack delivers full lifecycle application management. Its APM solution has:
- Distributed tracing for deep application analysis
- Real user monitoring with client side instrumentation
- Automatically generated topology maps
- Fast and powerful search and analytics
7. Instana
Instana emphasizes automated application monitoring powered by AI. Key features:
- Automatic APM instrumentation and baselining
- Actionable alerts with context
- Built-in infrastructure, logs, and website monitoring
- Trace analytics using machine learning
8. SolarWinds
SolarWinds APM supports hybrid and multi cloud environments. It includes:
- Distributed transaction tracing
- Customizable dashboards
- JVM and database monitoring
- Kubernetes and container visibility
- Predictive alerting algorithms
9. Micro Focus
The Micro Focus APM platform offers robust enterprise application monitoring. It has:
- Business transaction tracing and deep diagnostics
- Flexible custom dashboards
- Calculated metrics and attribute analysis
- Global data search across all components
10. Microsoft Azure Monitor
Azure Monitor is Microsoft’s native APM offering. It provides:
- Auto instrumentation of Azure workloads
- Map based transaction diagnostics
- Integration across Azure services
- Query capabilities via Azure Data Explorer
11. CloudWatch by Amazon Web Services (AWS)
CloudWatch delivers observability of AWS workloads and metrics. It features:
- Dashboards, events, metrics, and logs
- Alarms for anomalies and incidents
- X-Ray distributed tracing
- Lambda monitoring and Container Insights
12. Oracle Cloud Observability and Management
Oracle’s APM combines monitoring with log analytics including:
- Unified cross tier transaction tracing
- Custom dashboards and topological maps
- Anomaly detection powered by machine learning
- Built-in metrics monitoring
13. LogicMonitor
LogicMonitor supports performance monitoring across hybrid environments. It has:
- Automated discovery of infrastructure
- Customizable dashboards and reporting
- Threshold based alerts and anomaly detection
- Support for matrices, logs, and tracing data
14. Nagios
Nagios focuses primarily on infrastructure monitoring but also supports APM via plugins. Key capabilities:
- Monitoring automation for metrics and events
- Visualization via third party tools
- Extensive customization options
15. Zabbix
Zabbix provides open source infrastructure and application monitoring. It includes:
- Custom dashboards and notifications
- Automatic discovery of apps, servers, and devices
- Monitoring of logs, metrics, network, and cloud
- Wide range of monitoring plugins
16. Paessler PRTG
Paessler PRTG delivers unified monitoring and APM covering:
- Sensor based data collection
- Interactive maps
- Customizable dashboards and reports
- Alerting based on thresholds
17. Site24x7
Site24x7 offers cloud based performance monitoring including:
- Website, server, and application monitoring
- Transaction tracing and network path analysis
- Custom reporting and notifications
- Integration with various ITSM tools
18. BMC Helix
BMC Helix supports observability across public clouds. It provides:
- Auto instrumentation and discovery
- Operations logs, metrics, and traces analysis
- Incident management and IT workflow integrations
- Customizable dashboards and topology visualizations
19. Broadcom DX APM
Broadcom DX Application Performance Management delivers:
- Code level diagnostics with PurePath analysis
- User defined transaction tracing and SmartAgents
- Flexible rule builder for metrics, topology, and alerts
- Integration with third party analytics solutions
20. Riverbed AppInternals
Riverbed focuses on network performance. Its APM solution offers:
- Transaction diagrams with tier specific tracing
- Database monitoring
- Web server analytics
- Custom dashboards and role based views
21. Catchpoint
Catchpoint monitors end user digital experiences including:
- Real user monitoring from 350+ global vantage points
- Waterfall diagrams to analyze impact
- Alerts for availability, speed, errors
- Integration with notification tools
22. AppNeta
AppNeta’s SaaS based offering specializes in network performance monitoring and APM. Key features:
- Network flow monitoring and diagnostics
- Transaction waterfalls to isolate delays
- Application dependency mapping
- Custom analytics with filtering
23. NGINX Amplify
NGINX Amplify complements the NGINX server. It provides:
- Granular visibility into NGINX performance
- Easy deployment within NGINX ecosystem
- Infrastructure overview and application analytics
- Alerts based on usage thresholds
Conclusion
There are many excellent APM tools available today delivering capabilities like tracing, metrics, logging, alerting, and more. When selecting solutions, consider factors like supported languages and integrations, analysis depth, ease of implementation, scalability needs, and costs. Leading commercial, open source, SaaS and cloud-based options all exist. And many vendors offer free trials to test drive different products. Overall, APM is essential for modern DevOps teams to deliver exceptional application experiences even as complexity continues growing.
Frequently Asked Questions
What are the key capabilities of APM solutions?
Core capabilities typically include transaction tracing, metrics collection, logging, alerting, visual dashboards, topology mapping, and more. Advanced features like AI powered analytics are also gaining popularity.
What types of data do APM tools collect?
APM solutions gather performance telemetry like application response times, throughput, errors, infrastructure metrics, logs, network data, code level traces, business transactions, user sessions, and more.
How much do APM tools cost?
Pricing models include free open source tools, commercial licenses based on features/data volumes, and SaaS based subscriptions often charging per host/container. Enterprise wide deployments can cost over $100K annually.
What applications can APM solutions monitor?
Most APM platforms support monitoring popular languages (Java, .NET, Node.js, Python, Go, etc.) either auto detected or via language agents. Mainframe, cloud, mobile, web, messaging, database, and custom apps are also generally supported.
How difficult is it to implement APM tools?
Ease of implementation varies. SaaS based or auto instrumenting tools are simplest. Some solutions require manual instrumentation or agents installed per technology/host to enable deeper monitoring.

- How to Force Quit on Mac? (6 Methods That Actually Work) - May 24, 2026
- How to Move NFTs Between Blockchains (Complete Guide) - May 24, 2026
- How to Move a Column in Excel (A Simple Guide) - May 24, 2026