The cloud computing industry continues to expand at a remarkable pace. As more workloads move to the cloud, the need for comprehensive cloud monitoring and observability platforms becomes increasingly vital. Choosing the right tools can provide system administrators and DevOps teams with the visibility they require to ensure performance, availability, and efficiency.
This article explores 22 top rated cloud monitoring solutions capable of tracking metrics, aggregating logs, and providing alerts for infrastructure and applications running in public, private, and hybrid cloud environments.
What to Look for in a Cloud Monitoring Tool
When evaluating cloud monitoring tools, key criteria include:
- Cloud platform support – Ability to monitor major providers like AWS, Azure, and GCP
- Broad metric coverage – Infrastructure, logs, applications, services, and more
- Alerting and notification – Customizable alerts and robust notification options
- Visual data presentation – Intuitive dashboards, topology maps, and data visualization
- Automated discovery – Automatic detection of resources and mapping of dependencies
- Cost optimization – Helps reduce waste and control cloud spending
- Integration and collaboration – API and tool integrations for collaboration
Most Popular Cloud Cloud Monitoring Tool List
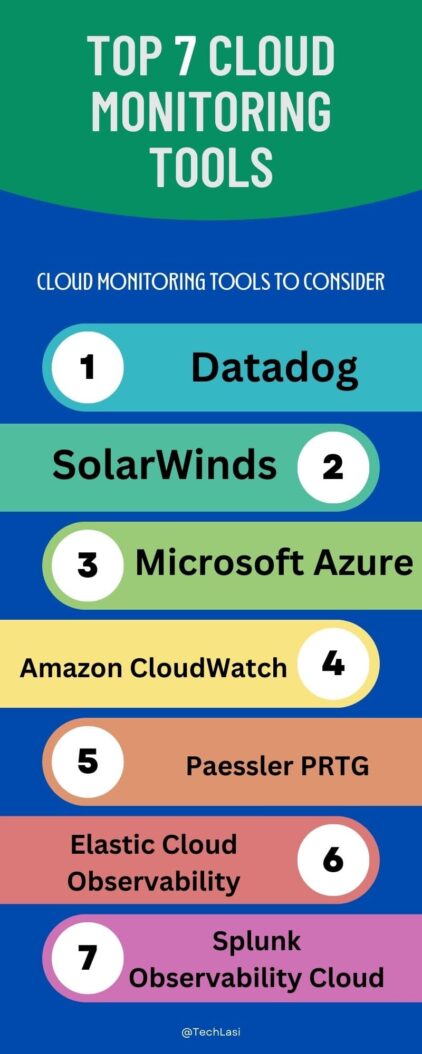
Keeping these features in mind, here are 22 capable tools to consider:
Datadog
**Key Features:**
- Unified visibility for metrics, traces, logs
- AWS, Azure, and GCP support
- Out of the box dashboards and alerts
- API for customization and integration
As a leading cloud monitoring platform, Datadog offers extensive capabilities for gaining observability across cloud environments. It provides a single UI for analyzing infrastructure/application metrics, distributed traces, and logs with advanced visualizations using intuitive dashboards. With robust platform support spanning hundreds of technologies, Datadog is a top choice for monitoring hybrid and multi cloud environments. Its collaboration features and open API also make it suitable for enterprise DevOps teams.
SolarWinds
Key Features:
- Agent based monitoring
- Customizable dashboards
- Log and event analysis
- Cost calculation for AWS
SolarWinds delivers unified cloud monitoring covering metrics, logs, and cost data through its SaaS based Application Performance Monitor (APM). Backed by over 20 years of IT management experience, it offers an agent based approach allowing for deeper infrastructure visibility supplemented by log management and event monitoring.
SolarWinds offers ample room for customization via flexible, widget based dashboards. Its cost calculation features also help administrators track AWS spending. For those seeking an on premises option, SolarWinds also provides the Server Configuration Monitor (SCM).
Microsoft Azure Monitor
Key Features:
- Native Azure monitoring
- Application map and transaction diagnostics
- Log Analytics and alerting
- Consumption and cost analysis
As Microsoft’s official cloud monitoring service, Azure Monitor delivers first party visibility, analytics, and alerts for Azure resources and workloads. Backed by Log Analytics, it offers seamless access to monitoring data including metrics, logs, and transactions. Azure Monitor creates useful visualizations like application topology maps showing communication between components. It also allows administrators to drill into app traffic via transaction diagnostics. Other strengths include configurable alert rules and cost management analytics.
Amazon CloudWatch
Key Features:
- Native AWS monitoring
- Dashboards, metrics, and logs
- Alarm creation and Route 53 health checks
- Cost tracking with budgets
As AWS’s native monitoring and observability service, Amazon CloudWatch provides centralized visibility into resources and applications. It delivers metrics, logs, and alarm capabilities which administrators can access via customizable CloudWatch dashboards. By surfaced performance data on AWS services, CloudWatch allows faster troubleshooting. It also features cost management via budget alerts and cost allocation tags. While more limited than standalone tools, CloudWatch offers simple monitoring tightly integrated with AWS.
Paessler PRTG
Key Features:
- Auto discovery of IT infrastructure
- Conditional alerting
- Custom maps and reporting
PRTG by Paessler takes an agentless, sensor based approach to infrastructure monitoring. It auto discovers devices on networks and employs sensors to collect system metrics ranging from bandwidth to HTTP transactions. PRTG consolidates data to provide administrators with comprehensive visibility. Flexible alerting and mapping enable administrators to pinpoint issues faster. PRTG also features role centered views, mass updates, and reporting. With support for major cloud platforms, it offers a unified monitoring solution across network, server, virtualization and cloud environments.
Elastic Cloud Observability
Key Features:
- Unified observability platform
- Metrics, APM, logs, and uptime monitoring
- Anomaly detection powered by machine learning
- Flexible visualization and dashboards
Formerly known as the Elastic Stack, Elastic Cloud Observability brings together capabilities for infrastructure monitoring, application performance management, and log analytics accessible through Kibana dashboards. By combining Elasticsearch, Beats, APM, Logs, and Uptime, Elastic Cloud Observability provides comprehensive observability across on prem and cloud environments. With powerful search and analytics, it enables real time insights into application and system health.
Splunk Observability Cloud
Key Features:
- Unified view with automatic tracing
- Full fidelity metrics and logs
- Prebuilt boards and topology views
- Public cloud architecture with security controls
Splunk Observability Cloud delivers a full stack observability platform emphasizing traces and logs. Employing always on profiling, it automatically instruments applications while providing granular metrics. Logs are also indexed and correlated in a unified platform. Splunk Observability Cloud surfaces key performance metrics via topology maps and intuitive dashboards. Its cloud native backend features advanced data pipelines to facilitate robust analytics. Role based access coupled with security controls also make it suitable for regulated industries.
Circonus
Key Features:
- Metrics, logs, and alerts consolidated into streams
- Agent and agentless monitoring options
- Anomaly detection and forecasting
- Real time stream monitoring and analysis
Circonus offers infrastructure monitoring designed specifically for cloud operations and large scale deployments. Its centralized platform aggregates metrics, events, logs and trace data into unified streams for analysis and alerting. Utilizing both agent and agentless techniques, Circonus provides flexibility in what data gets collected. Its analysis capabilities also help IT teams stay in front of problems via algorithms that detect anomalies and forecast trends. Streams enable nuanced alert policies while supporting automation through Circonus’s API.
OpsRamp
Key Features:
- Hybrid infrastructure monitoring
- AIOPS enabled event management
- Service maps with behavioral analytics
- ITSM and collaboration integration
OpsRamp provides hybrid and cloud monitoring capabilities combined with AIOps powered event correlation and automation. It offers complete visibility via key metrics across core infrastructure layers spanning on prem, cloud, and container environments.
Utilizing service topology maps supplemented by management packs for monitoring popular enterprise apps and cloud services, OpsRamp offers an enhanced context for issue investigation powered by its AI capabilities. Further enabling efficiency are ITSM, collaboration, and process automation integrations.
LogicMonitor
Key Features:
- Auto discovery for 2,200+ technologies
- Metrics, logs, and synthetic monitoring
- Automated capacity forecasting
- Financial dashboards for cloud spend
Delivering infrastructure monitoring designed for modern hybrid environments, LogicMonitor automatically discovers on prem, cloud, and container resources while collecting 1,200+ performance metrics. Its data platform entails metrics, logs, and element interfacing for building custom data connectors. LogicMonitor also provides visibility into cloud costs and usage trends with actionable financial dashboards. Its forecasting helps project capacity requirements through predictive modeling. Supported by a growing library of monitoring packs and management APIs, LogicMonitor makes scaling monitoring more manageable.
CloudOptics
Key Features:
- AWS and Azure support
- Resource optimization recommendations
- Cost tracking with custom tagging
- Agentless data collection at 5 minute intervals
CloudOptics delivers SaaS based visibility tailored to consumption and costs across leading public clouds. It centrally monitors services and resources while tracking expenses across multiple accounts. Cloud Optics leverages data analysis to provide actionable recommendations aimed at maximizing cloud efficiency.
With customizable dashboards and reporting encompassing compute, storage, and data transfer, CloudOptics caters to administrators and cloud architects seeking better cost control. Its agentless monitoring coupled with support for major cloud providers makes CloudOptics easy to implement.
Wavefront
Key Features:
- High cardinality metrics management
- Anomaly detection and forecasting
- Direct data ingestion from 350+ sources
- Powerful visualizations and dashboards
Wavefront stands out for its ability to collect, analyze, and visualize metrics at extreme scale across cloud environments with massive levels of dynamic resources. It offers unified observability data platform that handles the high velocity data streams from modern cloud workloads.
With 350+ native integrations with open APIs for custom data connectors, Wavefront can consolidate most critical metrics and logs within a single pane of glass. It also features intelligent anomaly detection and forecasting algorithms that facilitate faster troubleshooting.
Netdata
Key Features:
- Platform agnostic infrastructure monitoring
- Auto detected sensors for 2,000+ metrics
- Hierarchical dashboard visualization
- Anomaly detection and alarm notifications
As an open source, agent based monitoring tool, Netdata delivers comprehensive visibility across physical and virtual systems in on prem and cloud environments. It offers out of box monitoring for 2,000+ metrics from CPU and disk drives to web server analytics and Docker containers. Netdata’s fast polling, anomaly alerts, and hierarchical dashboards provide real time observability to help troubleshoot performance lags. It also consumes minimal CPU/memory resources while auto adapting to dynamic infrastructure changes. With companion tools for long term metrics storage and enterprise features, Netdata is highly extensible.
ThousandEyes
Key Features:
- End user monitoring and Internet visibility
- Synthetic monitoring from global vantage points
- Device layer network pathology diagnostics
- Cloud performance benchmarking
While most tools focus on internal infrastructure visibility, ThousandEyes provides unique insight into end-user digital experience. It monitors application availability, network connectivity, and web transactions from enterprise locations and major cloud providers. By continuously testing network paths and cloud services from around the globe, ThousandEyes quantifies performance while revealing issues that impact user experience. From DNS failures to ISP outages, its Internet and agent-based monitoring inform both IT staff and application owners.
AppDynamics
Key Features:
- Code level application performance insights
- Distributed transaction tracing
- Automated root cause analysis
- Platform support spanning cloud to mainframe
Delivering robust application performance management (APM) for cloud environments, AppDynamics specializes in transaction monitoring with code level diagnostics. It automatically maps out application architectures and traces end to end workflows across distributed systems.
Key strengths include contextual analytics with flows mapped to code, no code automated baselining to flag performance anomalies, and machine learning algorithms that identify root cause. With universal agents and controller, AppDynamics works across the latest cloud platforms as well as legacy systems.
ScienceLogic
Key Features:
- Unified monitoring for hybrid IT
- Cross stack topology visualization
- Automated discovery and dependency mapping
- ITSM integration and process workflows
ScienceLogic delivers consolidated monitoring, automation, and service assurance across legacy infrastructure, private data centers, public cloud platforms, and multi-cloud deployments. Its strength lies in automatically discovering resources and mapping dependencies across technology domains from network gear to Kubernetes clusters.
This unified visibility coupled with cross stack service models, topology views, and process integration enables administrators to quickly assess impact and service delivery risks. ScienceLogic also features mature ITSM alignment and remediation workflows.
Centreon
Key Features:
- Open source infrastructure monitoring
- Agent based monitoring of 10,000+ metrics
- Intuitive dashboard building
- ITIL based alerting and workflows
Offering enterprise grade, open source capabilities for monitoring hybrid IT, Centreon features an agent-based approach to collecting key performance data from networking, storage, virtualization, cloud, and custom apps. It consolidates metrics for analysis and visualization.
Micro Focus Operations Bridge
Key Features:
- Consolidated monitoring for multi cloud
- Cross stack topology modeling
- Workload modeling with capacity analytics
- ITSM integration with automated Runbook workflows
Micro Focus Operations Bridge delivers unified visibility and service model automation across legacy infrastructure, private cloud platforms, and public cloud environments. Utilizing real time dependency mapping, configuraition management analysis, and multilayer topology modeling, it supports smarter consolidation scenarios. Operations Bridge combines critical performance metrics with capacity analytics for predicting workload requirements and risks. Tight ITSM alignment also streamlines issue notification, event consolidation, and remediation via Runbook workflows.
Nagios XI
Key Features:
- Open source infrastructure monitoring
- 7,500+ third party plugins
- Auto discovered network mapping
- Robust alerting and event handling
Offering open source infrastructure monitoring combined with an enterprise grade UI, Nagios XI simplifies alerts and availability reporting for admins managing hybrid onprem and cloud environments. It utilizes plugins to collect status and performance data from servers, switches, applications, services, and public cloud platforms.
Site24x7
Key Features:
- Unified observability platform
- Server, application, network, and log monitoring
- Automated IT workflow integrations
- Public and private cloud support
Site24x7 offers a unified observability solution for modern IT infrastructure encompassing capabilities for server monitoring, application performance management, network analytics, and log analysis. Tight integration enables comprehensive monitoring across the IT stack in cloud and hybrid environments. Site24x7 features automated IT operations and incident management workflows spanning event alerts to trouble ticketing integrations with PagerDuty, ServiceNow and other platforms. With support for Kubernetes monitoring, Docker container visibility, and all major public clouds, Site24x7 aims to simplify observability.
StackPulse
Key Features:
- Kubernetes native monitoring and troubleshooting
- Real time health checks and alerts
- Automated root cause analysis
- GitOps integrations for autoscaling clusters
As a monitoring platform purpose built for Kubernetes in production, StackPulse emphasizes cluster health, container visibility, workload debugging, and autoscaling. It auto discovers resources while collecting 150+ metrics combined with events and logs. StackPulse’s continuous verification approach helps interpret signals, providing automated root cause identification to reduce mean time to detection and repair. Integrating natively with CI/CD pipelines and GitOps workflows, StackPulse also enables automation around scaling, healing, and configuration management.
Conclusion
With the massive growth in hybrid and multi cloud adoption, cloud monitoring and observability have become essential for delivering quality digital experiences while maximizing efficiency. The tools explored in this article represent leading options with advanced capabilities for collecting metrics, logs, and traces across critical infrastructure and services in cloud environments. By consolidating instrumentation data and surfacing insights via intuitive dashboards, these platforms empower administrators and application owners to maintain optimal performance, availability, and cost efficiency across complex, dynamic cloud architectures.
FAQs
What are the key things I should evaluate when choosing a cloud monitoring solution?
Some vital criteria include breadth of metrics coverage, platforms supported, data ingestion connectors, alerting and notifications, dashboard intuitiveness, automated discovery and mapping, cost optimization, integrations, scalability, and security. Prioritize capabilities that best match your hybrid cloud environment, internal processes, and budget.
What kinds of metrics can these tools monitor?
Leading solutions track dynamic metrics like CPU utilization, network bandwidth, application response times, service uptime, log events, container health, host disk space, memory pressure, database transactions, API calls, page load speed, and much more. Robust tools consolidate all critical telemetry.
How do cloud monitoring platforms analyze and visualize all this monitoring data?
They aggregate metrics, traces, and logs into time series databases purpose built for high velocity streaming data. Leveraging big data architectures, they run advanced analytics including anomalies detection, forecasting models, and multivariate correlation to surface insights. Dashboards transform signals into intuitive charts, topology maps, and alerts.
Can these tools integrate with other platforms in my environment?
Absolutely. Leading options offer open APIs, connector frameworks, and integration toolkits that facilitate syncing monitoring data bidirectional with popular ITSM, APM, log management, and collaboration solutions. This fosters more contextual investigation and streamlined issue resolution.
Which cloud monitoring tool is best for me?
The ideal fit depends on your cloud ecosystem, scale requirements, internal skill sets, processes, and budgets. Weigh options against the key criteria covered at the beginning of this article. Take advantage of free trials from top contenders before committing long term. Needs evolve so reassess as your infrastructure grows.
