When your internet stops working or a website refuses to load, tracert.exe is the diagnostic tool that shows you exactly where the problem is. This Windows utility traces the path your data takes across the internet, revealing every router and connection point between your computer and any destination. You’ll see precisely where delays happen, where connections fail, and how to fix network issues that frustrate you daily.
What Is Tracert.exe and Why It Matters
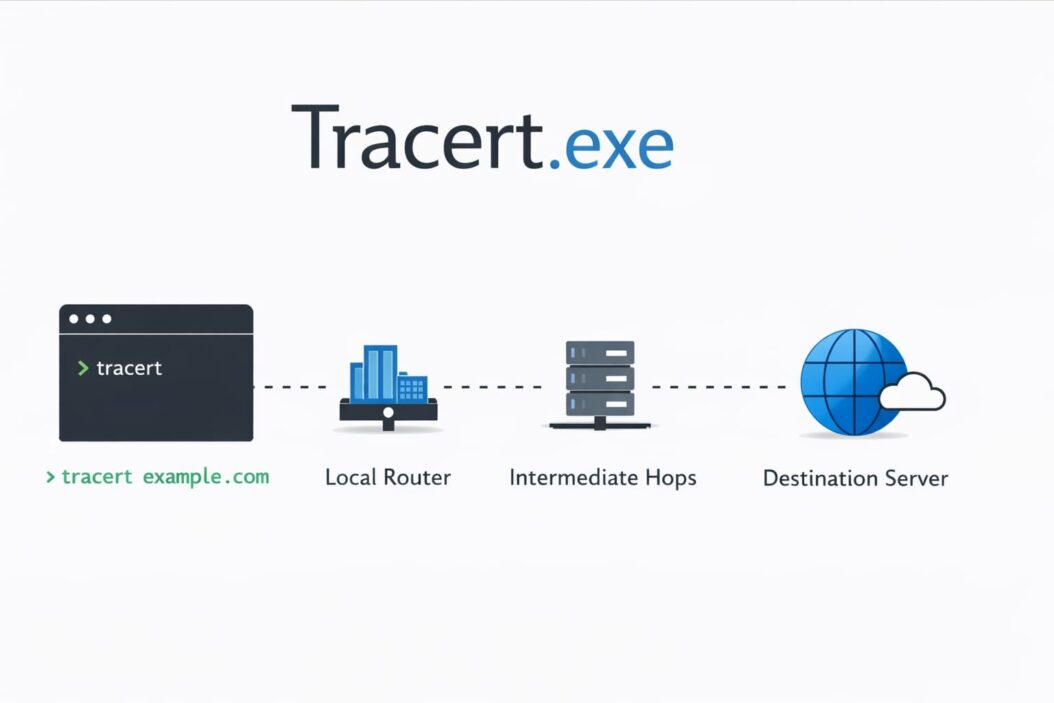
Tracert.exe (short for “trace route”) is a command-line program built into every Windows computer. It sends small test packets across your network and the internet, mapping the complete journey from your device to any web server, game server, or online service you specify.
Each packet reports back from every router it passes through. You get a numbered list showing:
- Every connection point (called a “hop”) along the route
- How long each hop takes in milliseconds
- The IP address or hostname of each router
- Where packets get lost or delayed
Think of it like tracking a package shipment, except you’re tracking your internet data through dozens of routers instead of through shipping warehouses.
When You Actually Need Tracert
You should run tracert.exe when:
Network problems occur: Websites load slowly, online games lag, video calls freeze, or connections drop randomly.
You need proof of an issue: Internet providers often blame your equipment. Tracert shows whether the problem exists on their network or beyond.
Troubleshooting remote servers: If your company’s VPN won’t connect or a specific website fails while others work fine, tracert identifies the broken link.
Comparing different routes: Network paths change. Running tracert at different times shows if your ISP is routing traffic efficiently.
How to Use Tracert.exe: Step by Step
Basic Command Syntax
Open Command Prompt by pressing Windows key + R, typing cmd, and hitting Enter. Then type:
tracert example.com
Replace “example.com” with any website, IP address, or server you want to test. Press Enter.
What Happens Next
The trace starts immediately. You’ll see lines appearing one by one:
Tracing route to example.com [93.184.216.34]
over a maximum of 30 hops:

  1    <1 ms    <1 ms    <1 ms  192.168.1.1
  2     8 ms     7 ms     9 ms  10.42.0.1
  3    12 ms    11 ms    13 ms  core-router.isp.net [203.0.113.1]
  4    24 ms    26 ms    25 ms  peer-gateway.example.net [198.51.100.1]
  5    28 ms    29 ms    27 ms  example.com [93.184.216.34]
Each line represents one hop. The three numbers are response times from three separate test packets. Lower numbers mean faster connections.
Reading the Results
Normal results show consistent times (usually under 100ms for most hops) with no asterisks or “Request timed out” messages.
Problem indicators:
- Asterisks (* * *) mean that router didn’t respond, often due to firewall settings
- “Request timed out” shows lost packets at that specific hop
- Sudden time jumps (from 20ms to 200ms) reveal network congestion
- The last responding hop before failures shows where the break occurs
Advanced Options You Should Know
Prevent DNS lookups for faster results:
tracert -d 8.8.8.8
The -d flag skips hostname resolution, showing only IP addresses.
Change the number of hops (default is 30):
tracert -h 15 example.com
This stops the trace after 15 hops, useful for testing local network issues.
Adjust timeout value (default is 4000ms):
tracert -w 1000 example.com
The -w flag sets milliseconds to wait for each response. Lower values speed up the trace but may miss slower routers.
Understanding Common Tracert Patterns
The “High Latency at One Hop” Pattern
Sometimes you’ll see this:
  5    22 ms    23 ms    21 ms  router-a.net
  6   185 ms   187 ms   189 ms  router-b.net
  7    24 ms    25 ms    23 ms  router-c.net
Hop 6 shows high latency, but hop 7 returns to normal. This usually means hop 6’s router prioritizes data traffic over diagnostic packets. Your actual internet traffic likely isn’t affected. Focus on patterns where high latency continues through subsequent hops.
The “Request Timed Out” Pattern
  8     *        *        *     Request timed out.
  9    45 ms    44 ms    46 ms  server.example.com
If the destination (hop 9) responds successfully, the timed-out router simply has ICMP responses disabled for security. Your connection works fine. The problem exists only when the destination itself times out.
The “Steadily Increasing Latency” Pattern
  3    12 ms    11 ms    13 ms
  4    89 ms    91 ms    88 ms
  5   156 ms   159 ms   157 ms
  6   224 ms   226 ms   223 ms
This shows real network congestion. Each hop adds significant delay. Usually indicates:
- ISP infrastructure problems
- International connection issues (crossing oceans adds latency)
- Overloaded backbone routes during peak hours
Common Problems Tracert Reveals
| Problem | What You See | Solution |
|---|---|---|
| Router failure | Consistent timeouts at one hop, destination unreachable | Contact ISP if failure is on their network |
| Network congestion | High latency (100ms+) starting at ISP hops | Test at different times; may need service upgrade |
| Firewall blocking | All hops timeout, but you can access the site | Normal behavior; tracert blocked but traffic flows |
| DNS issues | “Unable to resolve target system name” | Check DNS settings or use IP address directly |
| Local network problem | First hop (your router) times out or shows high latency | Restart router; check cables; test WiFi signal |
Tracert vs Pathping: Which Tool to Use
Windows includes another tool called pathping that combines tracert with extended statistics. It takes longer to run (several minutes) but provides better data for diagnosing intermittent problems.
Use tracert when:
- You need quick results
- Testing if a route is completely broken
- Checking current network path
Use pathping when:
- Connections drop randomly
- You need proof of packet loss percentage
- ISP support requests detailed statistics
Command: pathping example.com
Real Examples of Tracert Solving Problems
Example 1: Identifying ISP Issues
A user couldn’t access their company VPN. Tracert showed normal hops until reaching the ISP’s edge router, which timed out. All subsequent hops failed. This proved the ISP’s equipment had failed. The user showed tracert results to support, who identified and fixed a faulty router within hours.
Example 2: Gaming Lag Diagnosis
A gamer experienced lag spikes every evening. Running tracert during lag periods showed the 8th hop (a peering connection between networks) jumped from 40ms to 250ms. This proved the problem wasn’t their computer or local network. The ISP confirmed congestion at that peering point and rerouted traffic.
Example 3: International Connection Problems
A business couldn’t connect to their Asian data center from North America. Tracert revealed the route took 23 hops through European routers before reaching Asia, adding massive latency. Working with their hosting provider, they configured better routing that reduced hops to 14 and latency by 60%.
Saving and Sharing Tracert Results
When reporting network issues to support teams, save your tracert output:
tracert example.com > C:\tracert-results.txt
This creates a text file you can attach to support tickets. Support staff can analyze the exact path and timing without asking you to re-run tests.
For multiple tests over time:
tracert example.com >> C:\tracert-log.txt
The double arrow (>>) appends results instead of overwriting, building a historical record.
Security and Privacy Considerations
Tracert reveals your network topology and ISP infrastructure. While this information isn’t typically sensitive, be cautious about sharing raw tracert output publicly. It shows:
- Your router’s IP address
- Your ISP’s internal network structure
- Potential routes for network attacks
When sharing online or in forums, you can replace your first few hops with “local router” and “ISP router” descriptions instead of actual IP addresses.
According to networking best practices documented by the Internet Engineering Task Force (IETF), many network administrators configure routers to ignore ICMP echo requests (what tracert uses) for security reasons. This explains why some hops always show asterisks but doesn’t indicate actual problems.
Limitations You Need to Know
Tracert doesn’t show actual traffic routes: Your regular internet traffic may take different paths than tracert packets. Modern networks use load balancing and dynamic routing. Tracert provides a snapshot, not a guarantee of all routes.
ICMP can be blocked: Security policies often block the protocol tracert uses. Asterisks in results don’t always mean problems exist.
Results vary by time: Network routes change based on traffic load, time of day, and network optimization. Run multiple traces at different times for accurate diagnosis.
Doesn’t test bandwidth: Tracert measures latency (delay) not speed. A route with low latency might still have limited bandwidth causing slow downloads.
Alternative Tools for Deeper Analysis
MTR (My Traceroute): Available through Windows Subsystem for Linux or third-party tools like WinMTR. Combines tracert and ping with continuous monitoring. Download WinMTR for free from SourceForge.
PingPlotter: Commercial software providing visual graphs of network paths over time. Free version available for basic use.
Visual Traceroute: Shows geographic maps of your network route. Helps understand physical distance impacts on latency.
Troubleshooting Tracert Itself
“Unable to resolve target system name”
Your DNS isn’t working. Try using an IP address instead:
tracert 8.8.8.8
If this works but domain names fail, your DNS server has issues. Change DNS to Google’s (8.8.8.8) or Cloudflare’s (1.1.1.1) in network settings.
“Transmit failed. General failure”
Your network adapter or firewall is blocking outgoing packets. Check:
- Windows Firewall settings
- Antivirus software network protection
- Network adapter driver updates
- Whether VPN software is interfering
Tracert runs but shows only your router
Your router might be blocking ICMP packets from traversing to the internet. Log into router settings and check firewall rules. Some routers have “Block WAN ICMP” enabled by default.
Best Practices for Using Tracert
Run tracert three times when diagnosing issues. Network paths can change between tests. Consistent problems across multiple traces indicate real issues rather than temporary glitches.
Test multiple destinations. If google.com works perfectly but your-target-site.com fails, the problem is specific to that destination or its hosting provider, not your general internet connection.
Document results over time. Keep a log file of periodic traces to your most critical services. When problems occur, you’ll have baseline data showing what normal looks like.
According to networking documentation from Cloudflare’s Learning Center, combining tracert with other tools like ping and netstat gives you comprehensive network diagnostics. Each tool reveals different aspects of connectivity problems.
Understanding Geographic Impact on Routes
Tracert reveals physical distance’s effect on latency. Speed of light limitations mean:
- Cross-country US routes: 60-80ms minimum
- US to Europe: 100-120ms minimum
- US to Asia: 150-200ms minimum
- Global circumnavigation: 250-300ms minimum
If your tracert shows times near these minimums, you’re on optimal routes. Significantly higher numbers suggest suboptimal routing or network congestion.
When to Contact Your ISP
Bring tracert results to your ISP when:
- Multiple hops on their network consistently timeout
- Latency spikes occur specifically at their routers
- You can reach some internet destinations but not others
- Problems persist over several days despite your troubleshooting
ISP support often dismisses complaints without proof. Tracert provides objective evidence that either confirms your problem or reveals issues beyond their control.
Automating Tracert for Monitoring
For businesses or power users, scheduled tracert tests help identify patterns:
Create a batch file:
@echo off
echo %date% %time% >> C:\network-log.txt
tracert important-server.com >> C:\network-log.txt
echo. >> C:\network-log.txt
Use Windows Task Scheduler to run this hourly. You’ll build a historical database showing when and where network problems occur.
Mobile and Cross-Platform Alternatives
Android: Use apps like PingTools or Network Utilities
iOS: Download apps like Network Ping or iNetTools
Mac: Use built-in traceroute command in Terminal
Linux: Use traceroute or mtr commands
The concepts remain identical across platforms. Syntax varies slightly, but interpretation of results stays consistent.
Summary
Tracert.exe transforms network troubleshooting from guesswork into precision diagnosis. You now know how to:
- Run tracert commands with appropriate options
- Read results to identify where problems occur
- Distinguish real issues from normal network behavior
- Provide evidence when reporting problems to support teams
- Use tracert alongside other diagnostic tools
The tool takes seconds to run but reveals information that would otherwise require expensive network monitoring equipment. Every Windows user should know basic tracert operation for those frustrating moments when the internet fails.
Network problems have specific causes at specific locations. Tracert shows you both. Whether you’re troubleshooting home internet, diagnosing corporate network issues, or proving service quality problems to your ISP, tracert provides the objective data you need.
Frequently Asked Questions
Why does tracert show asterisks for some hops?
Routers showing asterisks (* * *) have ICMP responses disabled for security. This is normal behavior, not a problem. Your actual data traffic still flows through these routers successfully. Only worry if the destination itself shows asterisks or if every hop after a certain point times out.
How long should I wait for tracert to complete?
Tracert typically finishes in 10-30 seconds for working routes. If it sits at one hop for over a minute, that connection likely failed. Press Ctrl+C to cancel and examine results up to the failure point. The default timeout is 4 seconds per hop across 30 maximum hops.
Can tracert fix my internet connection?
No. Tracert is diagnostic only, it reveals problems but doesn’t repair them. Think of it like a thermometer for network health. It shows you have a fever (network problem) but doesn’t cure the illness. Use tracert results to guide actual fixes or provide evidence to your ISP.
Why do tracert results change each time I run it?
Internet routing is dynamic. Your packets may take different paths based on network load, routing policies, and infrastructure changes. Multiple routes to the same destination are normal. Consistent patterns across several traces indicate reliable issues worth investigating.
Is high latency at the last hop before my destination a problem?
Yes, if it’s consistently high. The last router before your destination often shows the most accurate representation of your actual connection quality to that server. If earlier hops show low latency but the final hop jumps dramatically higher, the destination server or its network connection is likely the bottleneck.

- How to Uninstall Apps from the Start Menu in Windows 11/10 (2026 Guide) - April 2, 2026
- How to Fix Overscan on Windows 11/10: Stop Your Screen Getting Cut Off (2026) - April 1, 2026
- How to Disable Lock Screen on Windows 11/10 in 2026 - April 1, 2026